December 23, 2025 Updates
1766491726000
What's New in Our Catalog
Newest Releases
 Build Multi-Agent Santa Quiz Game w/ Granite, CrewAI, Gradio | View in the Skills Network Catalog
Build your own multi-agent Santa Quiz Game with IBM Granite, CrewAI, and Gradio. Learn to orchestrate specialized agents with CrewAI agents and tasks to collaboratively research global traditions and generate interactive challenges. Use IBM Granite models to power high-quality text generation and secure environment variables for reliable system configuration. Integrate custom JavaScript snow effects and festive CSS styling to deliver a polished, immersive web interface. Explore how CrewAI enables agent collaboration and state-based logic to create a fully automated holiday experience.
Updates
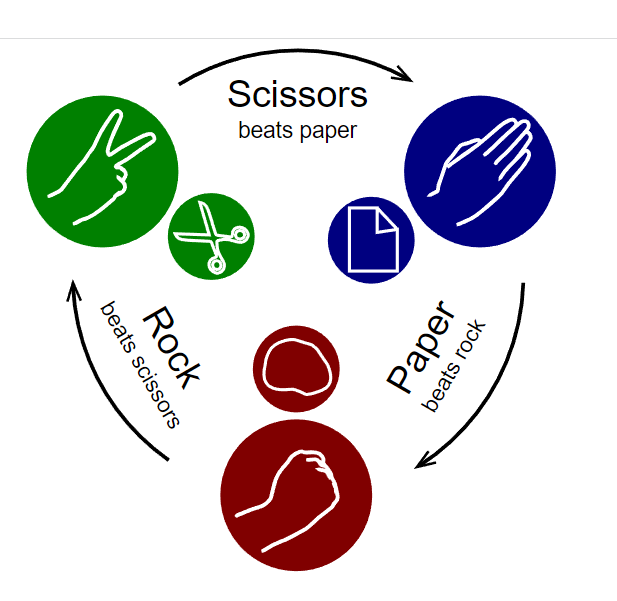 Python Mini-Game Project | View in the Skills Network Catalog
The project is a simulation of a popular game Rock-Paper-Scissor. This will help learners understand the usage of basic constructs of Python.
 A Technical Deep Dive on Liberty | View in the Skills Network Catalog
Liberty is a cloud-optimized Java runtime that is fast to start up with a low memory footprint and a development mode, known as dev mode, for quick iteration. Adding and removing features to adopt the latest open cloud-native Java API like MicroProfile and Jakarta EE are easy with Liberty. Liberty’s zero migration lets you focus on what’s important and not the APIs changing under you.
 Performing Table and CRUD Operations with Cassandra | View in the Skills Network Catalog
In this guided project, you will create a table and perform create, read, update, delete (CRUD) operations in Cassandra using the CQL shell (cqlsh) command line interface.
 Data Visualization with Python | View in the Skills Network Catalog
Data visualization is the graphical representation of data in order to interactively and efficiently convey insights to clients, customers, and stakeholders in general. It is a way to summarize your findings and display it in a form that facilitates interpretation and can help in identifying patterns or trends. In this course you will learn how to create interesting graphics and charts and customize them to make them more effective and more pleasing to your audience.